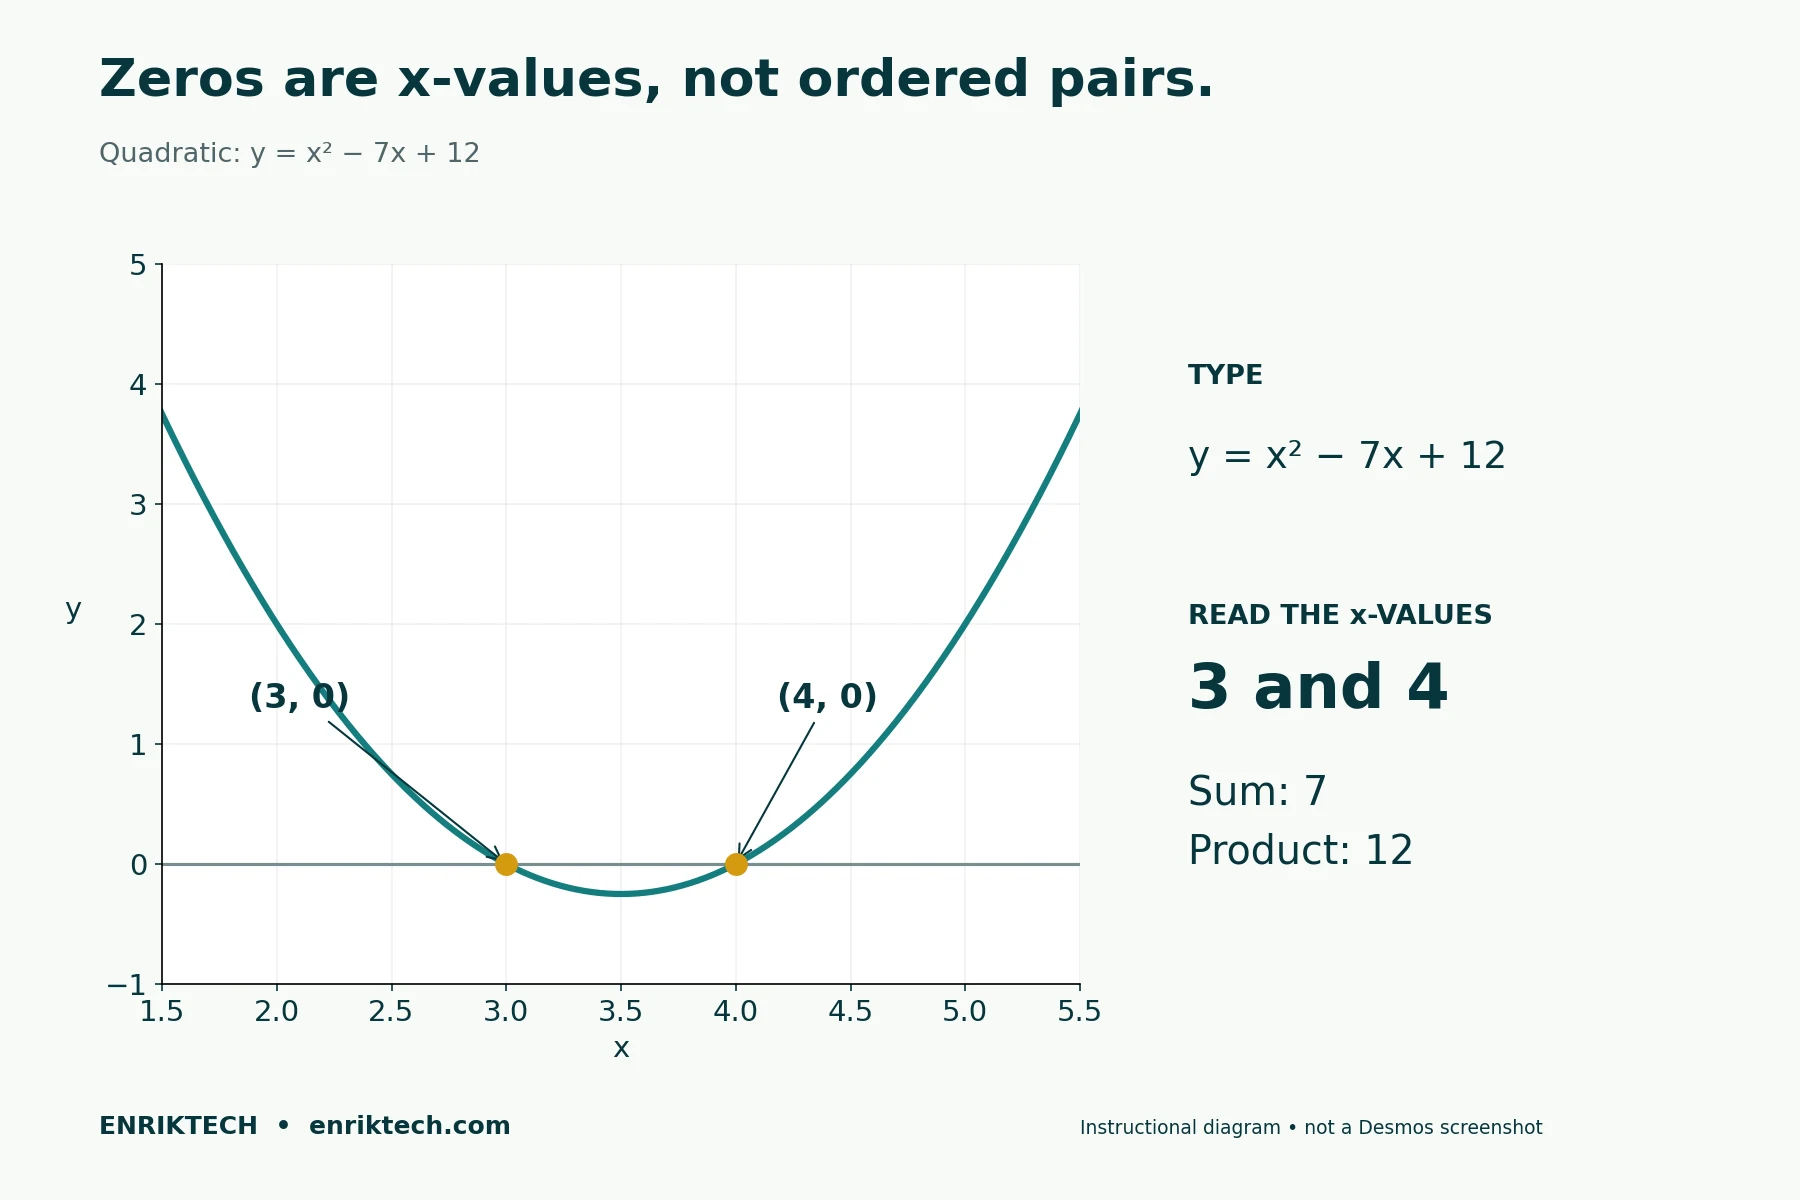

A system of equations gives you an intersection at (6, 2). The question asks for x + y. Your answer is 8—not either coordinate on its own.
That final step is where calculator work can go wrong. Desmos can find a point, evaluate an expression, or fit a model. You still need to enter the right relationship and interpret the result.
This guide covers nine useful methods for SAT Math. Each lesson gives you a worked example, entries you can type, and a check to help you avoid a wrong answer. The examples are original SAT-style practice, not official College Board questions.
Start here: If you are new to Desmos, work through equations, systems, zeros, and vertices first. Then try tables and regression. If you already know the controls, use the practice questions to identify which steps need work.
Start with the calculator you will use on test day
Bluebook includes Desmos graphing and scientific calculator options for SAT Math. Practice in Bluebook or use the College Board version of Desmos. College Board recommends becoming familiar with the embedded calculator before the test. [1]
Do not assume every feature in an online tutorial appears in the testing calculator. Desmos explains that testing versions can differ from the standard website. [2]
For the examples below, use the graphing option. Before working under time pressure, practice these actions:
- Enter two expressions on separate lines.
- Select a graph and then an intersection or intercept to display its coordinates.
- Zoom out, pan, and change the viewing window.
- Enter parentheses, fractions, powers, and square roots correctly.
- Delete old expressions and variable definitions before starting another problem.
Desmos identifies graph features such as intercepts and intersections as points of interest. Select the curve to locate them, then select the relevant point to display its coordinates. [3]
Choose the method before typing
| What the question asks | Useful approach | What to read or calculate |
|---|---|---|
| Solve an equation | Graph the two sides | The x-coordinate of each intersection |
| Solve a system | Graph both equations | The intersection’s x- and y-coordinates |
| Find zeros | Graph the function | The x-coordinates where y = 0 |
| Find a quadratic maximum or minimum | Locate the vertex | Usually the y-coordinate; read the wording |
| Evaluate a function | Define it and enter the requested input | The numerical output |
| Match an equation to a table | Compare predicted and given values | Whether every required point matches |
| Find a model from data | Use an appropriate regression | The fitted coefficients and their meaning |
| Find a parameter that gives no or infinitely many solutions | Compare coefficients or slopes first | The exact condition on the parameter |
Use this table as a starting point. If a question takes one line of algebra, entering two graphs may add work.
1. Solve an equation by graphing both sides
Example: Solve 3(x − 2) = 2x + 5.
Enter these on separate lines:
y = 3(x - 2)
y = 2x + 5
The graphs intersect at (11, 27). At this point, both expressions have the same value.
The question asks for x, so the answer is 11, not 27.
Check it in the original equation:
3(11 - 2) = 27
2(11) + 5 = 27
When to use this: The same approach works when the two sides contain quadratics, absolute values, or other expressions that take longer to solve algebraically.
When to skip it: For this particular example, distributing and subtracting gives x = 11 quickly. The graphing method is useful to learn, but it is not automatically the fastest method for every equation.
What if the intersection is not visible?
The intersection in this example is outside the usual starting window, both to the right and above. Zoom out or change the axis bounds. An empty-looking screen does not mean there is no solution.
2. Solve a system without rearranging both equations
Example: The system below has solution (x, y). What is x + y?
2x + 3y = 18
x - y = 4
Enter the equations as written. You do not need to solve each one for y first.
The intersection is (6, 2).
Check both equations:
2(6) + 3(2) = 18
6 - 2 = 4
Then answer the actual question:
x + y = 6 + 2 = 8.
The calculator has found the ordered pair. You still need to calculate the requested quantity, which could be x, y, x + y, or an expression such as 2x − y.
3. Distinguish one solution, no solution, and infinitely many solutions
For two nonvertical lines:
| Relationship between the lines | Number of solutions |
|---|---|
| Different slopes | One |
| Same slope, different y-intercepts | None |
| The same line | Infinitely many |
Two distinct vertical lines are also parallel; a vertical line and a nonvertical line intersect once. A graph helps you see these relationships. Algebra confirms them, especially when two lines are close together or overlap.
Example: For what value of k does this system have infinitely many solutions?
3x - y = 4
6x - 2y = k
Multiply the entire first equation by 2:
6x - 2y = 8The two equations describe the same line when k = 8.
If k ≠ 8, the variable coefficients remain proportional while the constants differ. The lines are parallel and distinct, so there is no solution. This system cannot have exactly one solution for any value of k.
Desmos check: Enter the first equation and the second with k replaced by 8. The graphs overlap. Toggle one graph off and on to compare them.
Common mistake: Doubling only the x-coefficient. Every term must be multiplied, including the y-term and the constant.
4. Find zeros and interpret the number of real solutions
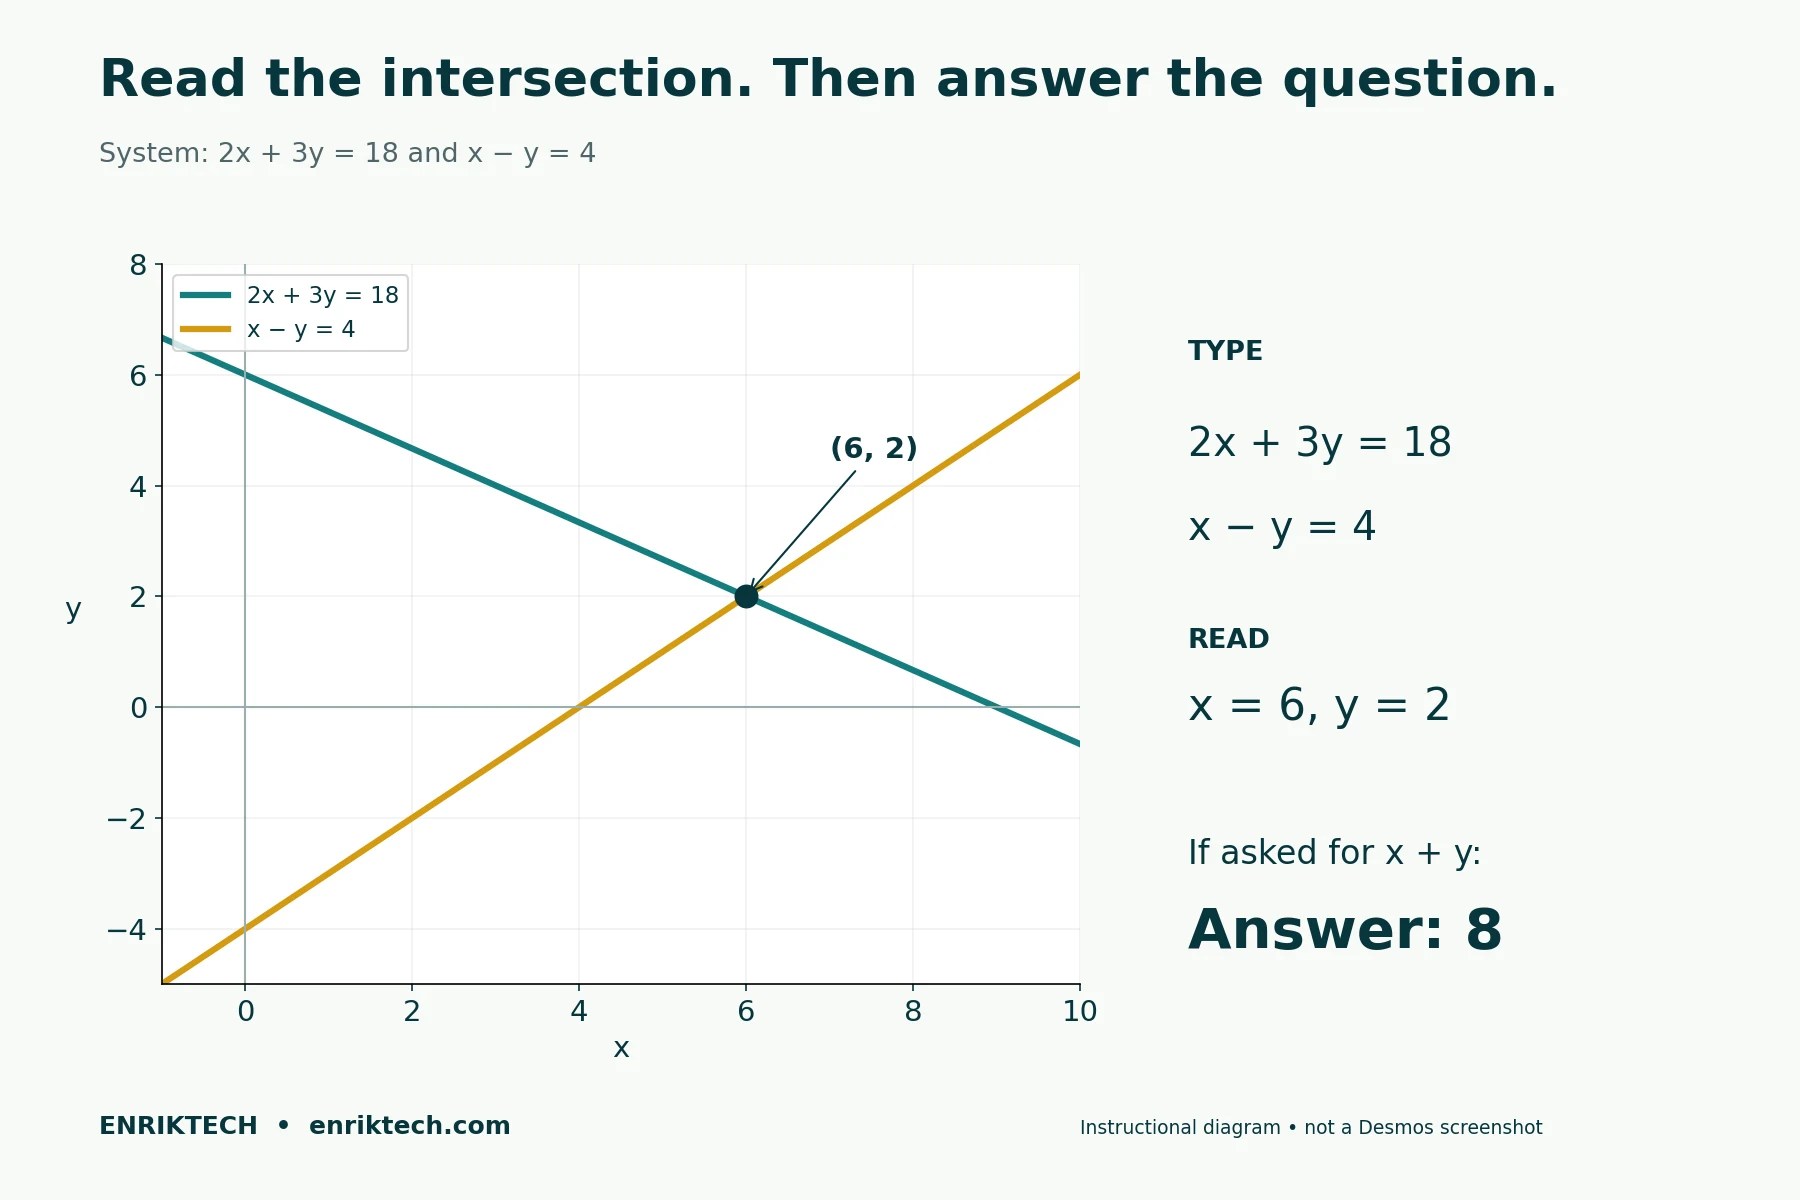
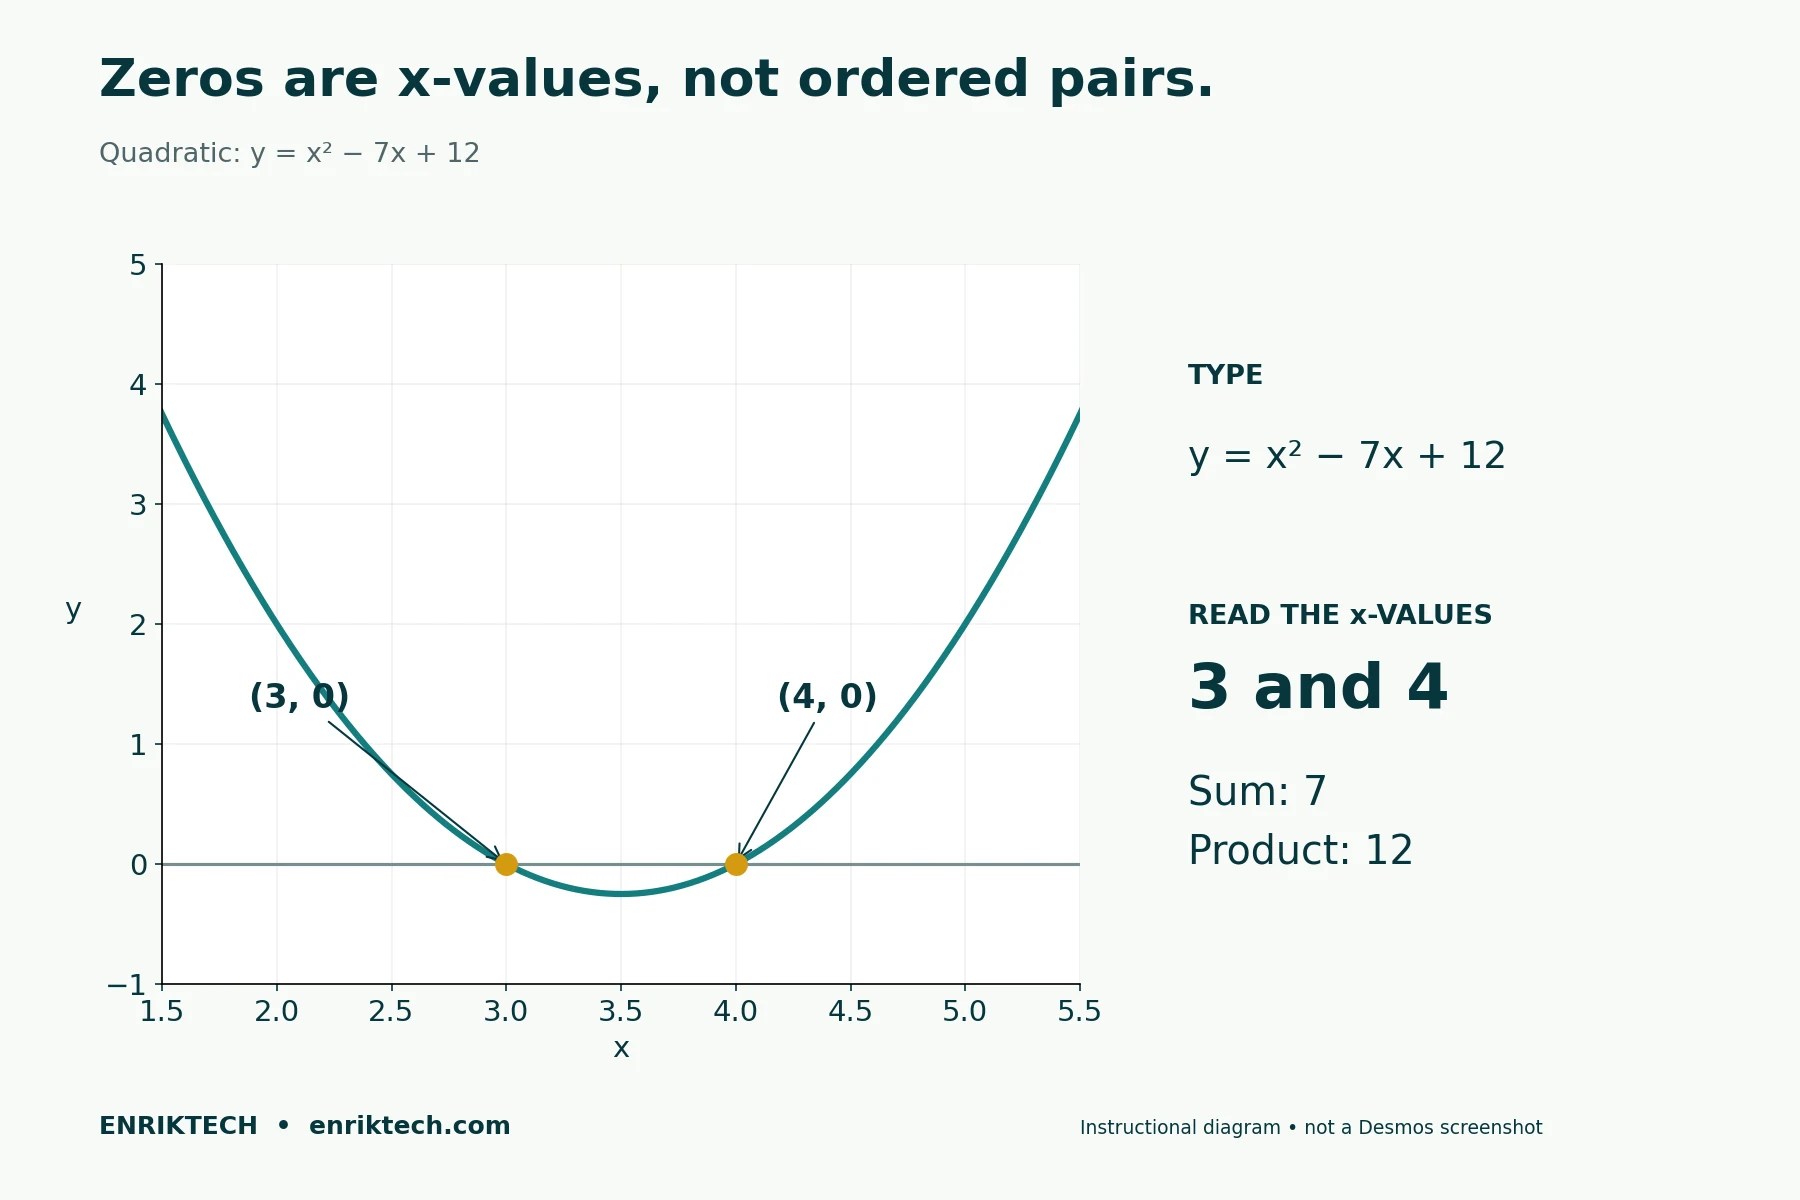
Example: What are the solutions of x² − 7x + 12 = 0?
Enter:
y = x^2 - 7x + 12The x-intercepts are (3, 0) and (4, 0). The solutions are therefore x = 3 and x = 4.
If the question asks for their sum, answer 7. If it asks for their product, answer 12.
Factoring gives a quick confirmation:
x^2 - 7x + 12 = (x - 3)(x - 4)Count distinct solutions carefully
A quadratic can cross the x-axis twice, touch it once, or have no real x-intercepts. A repeated root counts as one distinct real solution.
Do not rely only on how many labeled points appear in your current view. Adjust the window and use algebra when you need to confirm a count.
5. Find a maximum or minimum without confusing the coordinates
Example: A ball’s height in feet after t seconds is modeled by:
h(t) = -16t^2 + 64t + 5What is its maximum height?
For the graph, let x represent time and enter:
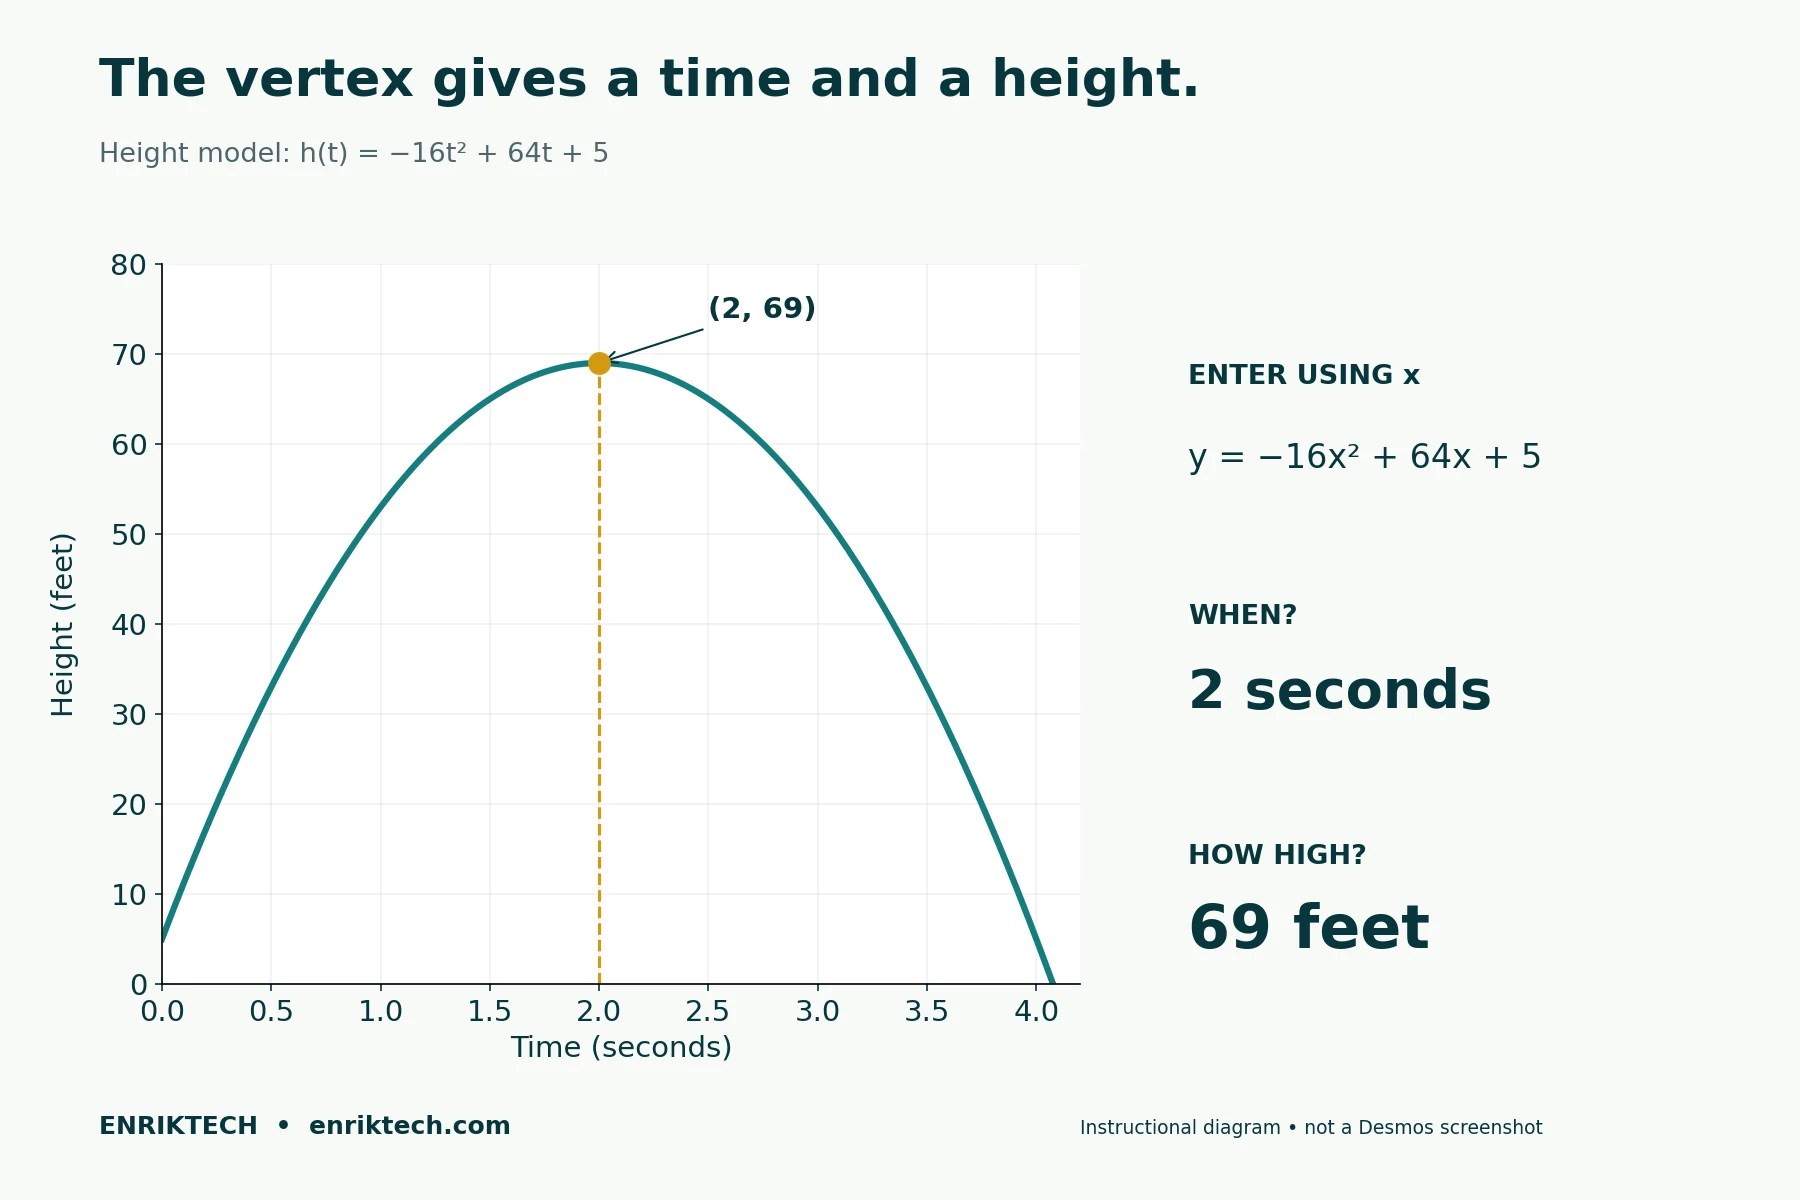
y = -16x^2 + 64x + 5The parabola opens downward. Its vertex is (2, 69).
That means:
- The ball reaches its maximum height after 2 seconds.
- Its maximum height is 69 feet.
The answer to this question is 69, because it asks for height.
You can check the vertex time with −b/(2a):
-64 / (2 × -16) = 2Then substitute 2 into the height expression.
Read the domain: In a real-world question, time may be restricted. If the vertex falls outside the allowed interval, it may not give the maximum or minimum for that interval; check the endpoints too.
6. Evaluate functions directly
Example: If f(x) = 2x² − 3x + 4, what is f(−2)?
Enter:
f(x) = 2x^2 - 3x + 4
f(-2)
The result is 18.
This avoids estimating a value from a graph. Function notation is especially useful when you need several outputs from the same expression.
For a composite function, define both functions first:
f(x) = 2x + 1
g(x) = x^2 - 3
f(g(4))
Here, g(4) = 13 and f(13) = 27.
Common mistake: Treating f(g(4)) as f(4) × g(4). Composition means using one function’s output as the other function’s input.
7. Use a table to check several inputs
Suppose a question provides these values:
| x | y |
|---|---|
| 0 | 5 |
| 1 | 8 |
| 2 | 11 |
| 3 | 14 |
The outputs increase by 3 each time x increases by 1, and y = 5 when x = 0. The linear rule is y = 3x + 5.
To check a candidate function:
- Enter
f(x) = 3x + 5. - Add a table.
- Enter 0, 1, 2, and 3 in the x₁ column.
- Use
f(x_1)as the second column’s heading. - Compare the calculated outputs with the given values.
Desmos supports function-based table columns, so it can calculate outputs from your chosen inputs. [4]
Do not check just one row. Several answer choices may share the same y-intercept or pass through one of the listed points. A valid answer must satisfy every condition in the question.
Matching a finite table also does not prove that two expressions are equivalent for every possible x. For an identity, use algebra to confirm.
8. Use regression when you actually need a model
Regression estimates coefficients for a model from data. It can be useful when a question asks for a line or curve that fits a table.
Start with the same four points from the previous section. Add them to a table with column names x₁ and y₁, then enter:
y_1 ~ m x_1 + bUse the tilde ~, not an equals sign. Desmos uses the named table columns to fit the model and reports the parameter values. [5]
For this exact data set, the result is m = 3 and b = 5.
If the model is quadratic, the corresponding entry is:
y_1 ~ a x_1^2 + b x_1 + cUse the model specified or justified by the problem. A regression does not decide whether the situation should be linear, quadratic, or exponential.
Other points to remember:
- Exact data can produce an exact fit. Measured data usually do not.
- A fitted coefficient may be approximate. Keep enough precision for the requested answer.
- Delete earlier definitions of m, b, a, or c before asking Desmos to estimate them.
- For the simple linear table above, recognizing the constant change is faster than entering a regression. Learn the tool without forcing it into every problem.
Practice the typed regression method in the testing calculator rather than depending on a shortcut button from the standard website.
9. Use numerical checks carefully
Example: A square’s side length increases by 20%. By what percentage does its area increase?
If the original side length is s, the new side is 1.2s. Therefore:
New area = (1.2s)^2 = 1.44s^2The new area is 144% of the original area, so the increase is 44%.
You can confirm with:
(1.2^2 - 1) × 100Entering only 1.2^2 × 100 gives 144, the new area as a percentage of the original. It does not give the percentage increase.
The tempting answer, 40%, misses the extra 4%:
(1 + 0.2)(1 + 0.2) = 1 + 0.2 + 0.2 + 0.04The calculator handles the arithmetic. You supply the relationship between side length and area.

Mistakes that can undo a correct method
Leaving out parentheses
To enter (x + 3)/(x − 2), type:
(x + 3)/(x - 2)Typing x + 3/x - 2 describes a different expression.
Similarly, (-3)^2 equals 9, while -3^2 equals −9.
Treating a decimal label as exact
A displayed coordinate can be rounded. If the answer choices use fractions or radicals, use algebra or substitution to identify the exact value. For student-produced responses, follow Bluebook’s answer-entry directions; do not invent a rounding rule.
Ignoring restrictions
If a problem requires x > 0, a negative intersection is not an acceptable answer. For a rational expression, exclude values that make a denominator zero. If you square both sides of an equation, check possible solutions in the original equation.
Trusting visual overlap as proof
Two graphs can appear identical at one scale without representing the same function everywhere. Zooming can help reveal a difference, but algebra is the stronger check for an identity or a parameter condition.
Forgetting angle settings
Check degrees or radians before entering a trigonometric calculation. The calculator’s setting needs to match the angle measure in the problem.
Carrying old work into a new question
Old graphs make it easier to select the wrong point. Old variable definitions can change new expressions. Start with a clean workspace when necessary.
A practice routine that builds speed
Use a short mixed set rather than repeating the same calculator action until it feels easy.
- Read the final question first. Identify the quantity you need: a coordinate, a sum, a maximum, a percentage, or a parameter.
- Choose a method. Decide whether algebra, a graph, a table, or direct calculation is likely to be quickest.
- Solve and check. Substitute a solution into the original equation or make a quick reasonableness check.
- Record the cause of an error. Separate setup mistakes, typing mistakes, graph-window problems, and misreading the question.
- Practice inside Bluebook. Build familiarity with the actual testing environment. [1]
Under timed conditions, avoid repeatedly adjusting a graph without making progress. Mark the question for review, move on within the module, and return with a different approach if time remains.
Five questions to practice
Try each one before reading the answers. Choose a method before opening the calculator.
1. Absolute-value equation
Find all real solutions of |2x − 3| = x + 6.
2. System
If 2x + y = 14 and x − y = 1, what is x + y?
3. Zeros
What is the larger solution of x² − 9x + 20 = 0?
4. Maximum
What is the maximum value of f(x) = −x² + 10x − 9?
5. Parameter
For what value of k does the following system have infinitely many solutions?
4x + 6y = 10
2x + 3y = k
Answers and checks
1. x = −1 or x = 9. Enter y = abs(2x - 3) and y = x + 6. The intersections are (−1, 5) and (9, 15). Zoom out if needed to see both.
Check both solutions in the original equation: at x = −1, both sides equal 5; at x = 9, both sides equal 15. For an algebraic check, split the absolute value at x = 1.5 and solve each branch on its allowed interval.
2. 9. The intersection is (5, 4), so x + y = 9. Check: 2(5) + 4 = 14 and 5 − 4 = 1.
3. 5. The zeros are 4 and 5. The question asks for the larger one.
4. 16. The vertex is (5, 16). Report its y-coordinate because the question asks for the maximum value.
5. k = 5. Divide every term in the first equation by 2. The result is 2x + 3y = 5.
Use your practice results to decide what to work on next. If your entries are correct but your answers are wrong, focus on interpreting coordinates and reading the requested quantity. If you know the method but lose time typing, practice a few representative entries in the testing calculator.
Quick questions about Desmos on the SAT
Can I use the regular Desmos website to practice?
You can use it to learn general controls, but do final practice in Bluebook or the College Board testing version. Features may differ. [1, 2]
Does a graph give the exact answer?
Not always. A coordinate label may be rounded. Use substitution or algebra when you need to distinguish exact fractions, radicals, or very close answer choices.
Should I graph every algebra question?
No. First check whether rearranging, factoring, or comparing coefficients gets you there more directly. Your goal is a correct answer with fewer opportunities for error.
More SAT practice on Enriktech
Try 25 Essential SAT Algebra Practice Questions after completing this guide. For each question, decide whether Desmos or algebra is the better first step, then check your result.
You can also browse the SAT category for related practice sets and explanations.
Official references
Calculator information checked October 10, 2026. Examples and practice explanations are original to this guide.
- College Board: SAT Suite Calculator Policy
- Desmos: Practice With Testing Calculators
- Desmos: Getting Started—Graphing Calculator
- Desmos: Tables
- Desmos: Regressions
- Desmos: College Board Testing Calculators
Discover more from Enriktech.com
Subscribe to get the latest posts sent to your email.